Your second-worst review is probably all you need

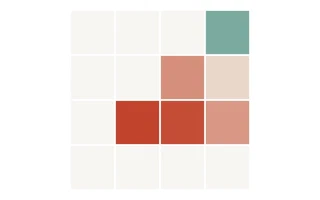
Two low scores on your ICLR paper is a death sentence. One savage review, on its own, you can survive. Two, and it is over: about a one-in-fifty shot, however enthusiastic your other reviewers are. The score that matters most is not your worst review. It is your second-worst. I know this because ICLR publishes its rejections, and nine years of them tell the same story.
Only ICLR shows you the losses
All three big ML conferences use OpenReview, so you might assume all three make their reviews public. They do not. NeurIPS and ICML show the papers that got in and quietly remove the ones that did not, reviews included. Pull NeurIPS from OpenReview today and it looks like the conference accepts $95\%$ of what it receives, because the only rejections left standing are the handful of authors who chose to un-hide theirs. ICLR is the exception. It leaves rejected papers up, scores and reviews intact, thousands a year going back to 2018. I can only say your second-worst review predicts your fate about ICLR, because ICLR is the only one of the three that will show you the papers that lost.
Four rubrics, one effect
The pattern holds across every version of the scoring rubric, and ICLR changed rubrics four times:
| Years | Scale | Type |
|---|---|---|
| 2018, 2019, 2021 | 1–10 | full integer slider |
| 2020 | 1, 3, 6, 8 | 4-rung ladder |
| 2022–2025 | 1, 3, 5, 6, 8, 10 | 6-rung ladder (one step between “marginally below” and “marginally above”) |
| 2026 | 0, 2, 4, 6, 8, 10 | even integers |
Four score sheets in nine years. The second-worst effect shows up on all of them. It is not an artifact of the rubric, because the rubric kept changing and the effect did not.
The wall
Every ICLR 2024 paper with four reviewers, arranged by its two lowest scores (which panel) and its two highest (which square inside the panel), shaded by acceptance rate. These are final, post-rebuttal scores, so a paper in a doom cell is one whose rebuttal already failed to move its reviewers.
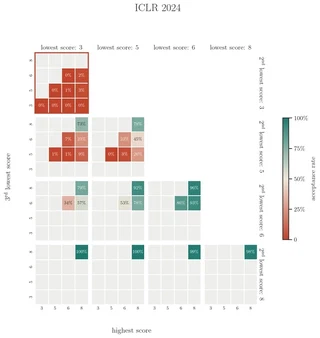
The red is what you notice first. That top-left corner is papers whose two lowest scores both landed on 3. It is a wall, and no combination of high scores on the other two reviews climbs out of it. Papers with just one 3 and a second-lowest of 6 or above accept at about $50\%$ ($n = 108$). Two 3s, no matter the top pair, accept at about $2\%$ ($n = 338$). The difference between one low score and two is the whole story.
But isn’t the mean a better predictor?
Your instinct might be to point out that the mean score predicts better. It does. Logistic regression on the mean gives a cross-validated AUC of $0.94$; the second-lowest alone gives $0.89$. The mean uses all four scores, so it has more to work with. But the question is which of the four scores the prediction leans on most, not which summary statistic wins.
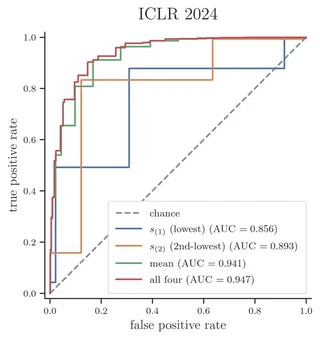
The four scores together predict acceptance at an AUC of $0.95$ in held-out folds. I added $44$ more features (soundness, presentation, contribution sub-scores, reviewer confidence, word count, question count, submission timing) and the AUC did not move. With ${\sim}3{,}700$ papers and correlated predictors, that is not proof those features carry zero signal, but it is worth noting.
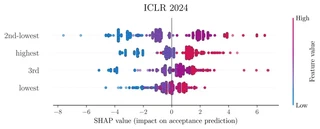
Within those four, a decision tree splits at the root on the second-lowest score (call it $s_{(2)}$, where $s_{(1)}$ is the min, $s_{(3)}$ the third, and $s_{(4)}$ the max), at the $5/6$ boundary. Logistic regression gives $s_{(2)}$ the largest standardized coefficient (about $2\times$ $s_{(1)}$, $3\times$ $s_{(4)}$). Permutation importance from random forest and gradient boosting agrees. Shapley values tell the same story:
| Score | mean $\lvert$SHAP$\rvert$ | most important for |
|---|---|---|
| $s_{(2)}$ (2nd-lowest) | $2.06$ | $58\%$ of papers |
| $s_{(4)}$ (highest) | $1.17$ | $16\%$ |
| $s_{(3)}$ (3rd) | $1.13$ | $25\%$ |
| $s_{(1)}$ (lowest) | $0.61$ | $< 2\%$ |
All four scores matter. $s_{(2)}$ is first and $s_{(1)}$ is last. The worst score, the one you are fixated on, is the most important for fewer than one in fifty papers.
Why the second-lowest?
Why might the second-lowest carry so much weight? A single low score is a dissent, and area chairs see dissents constantly. They have ways to dismiss them: a reviewer who skimmed, a mismatch in taste, an off day. A second low score is harder to dismiss. It is two independent readers arriving at the same conclusion, and that is much harder for an area chair to wave away. The veto, in other words, needs a second. (This is speculation about AC behavior, not something the data proves. Reviewers see each other’s scores during discussion, so the second low score is not necessarily independent of the first.)
The floor holds
The wall is stubborn. In 2024, the best-case rescue (two 3s and two 8s, $n = 6$) stayed in the single digits. Across common score combinations with enough papers to measure, nothing with two floor-level scores climbs much higher. In 2026, on the new scale, two 2s with two 8s accepted at $25\%$ ($n = 91$), up from near-zero on older scales but still below the 2026 baseline of $39\%$. The wall shifts with the rubric but does not disappear.
Next time your scores land, don’t dwell on the lowest one. Look at the one above it. That is the number that probably already sealed your paper’s fate.
